Server Monitoring Settings
PRTG Settings
Home >> Settings >> Server Monitoring >> PRTG Settings
In the PRTG Settings section, you can configure and integrate PRTG with the Automation platform for monitoring the servers. These settings can be done for available hosting servers, client servers and VPS.
To access the PRTG Settings section:
- Go to Settings.
- Click on PRTG Settings in the Server Monitoring section.
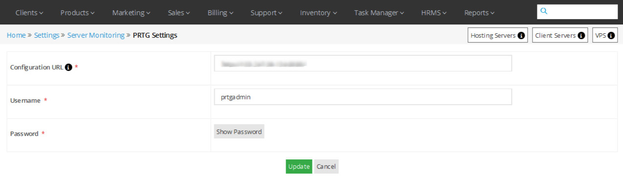
In the main PRTG Settings section, you can view and edit the configuration for integration of PRTG with the Automation Platform.
You can enter/edit the following entities
- Configuration URL (URL/IP Address of the server where PRTG is installed).
- Username & Password of the server.
- Click on the Update button to save the settings.
See sample screenshot of the PRTG settings section:
View/Edit PRTG Settings for Hosting Servers
Home >> Settings >> Server Monitoring >> PRTG Settings >> Hosting Servers
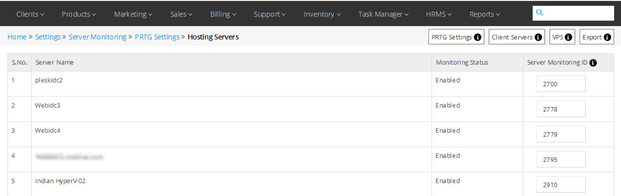
In the Hosting Servers section, you can view and edit the PRTG Server Monitoring ID for the available hosting servers.
To access the Hosting Servers section:
- Click on the Hosting Servers button.
In the Hosting Servers section, the information about the Hosting Servers is listed in the below-given sequence.
- Server Name – Status (Enabled/Disabled) – Server Monitoring ID
Here, you can enter/edit the PRTG server monitoring ID for each server to enable monitoring of the server with PRTG.
See sample screenshot of the Hosting Servers section:
Export Hosting Server Details
To export the complete details of the hosting servers with PRTG server monitoring ID in a CSV (excel) file.
- Click on the Export button in the Hosting Servers section.
View/Edit PRTG Settings for Client Servers
Home >> Settings >> Server Monitoring >> PRTG Settings >> Client Servers
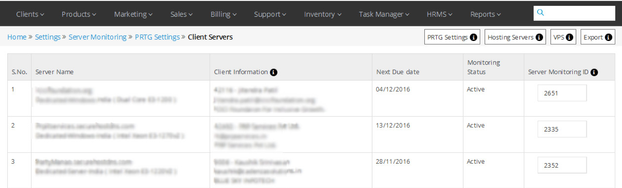
In the Client Servers section, you can view and edit the PRTG Server Monitoring ID for the allotted client servers.
To access the Client Servers section:
- Click on the Client Servers button.
In the Clients Servers section, the information about the Client Servers is listed in the below given sequence.
- Server Name – Client Information – Next Due Date – Monitoring Status – Server Monitoring ID
Here, you can enter/edit the PRTG server monitoring ID for each client server to enable monitoring of the server with PRTG.
See sample screenshot of the Client Servers section:
Export Client Server Details
To export the complete details of the client servers with PRTG server monitoring ID in a CSV (excel) file.
- Click on the Export button in the Client Servers section.
View/Edit PRTG Settings for VPS
Home >> Settings >> Server Monitoring >> PRTG Settings >> VPS
In the VPS section, you can view and edit the PRTG Server Monitoring ID for the allotted VPS.
To access the VPS section:
- Click on the VPS button.
In the VPS section, the information about the each VPS is listed in the below given sequence.
- VPS Name – Client Information – Next Due Date – Monitoring Status – VPS Monitoring ID
Here, you can enter/edit the PRTG server monitoring ID for each VPS to enable monitoring of the VPS with PRTG.
See sample screenshot of the VPS section:
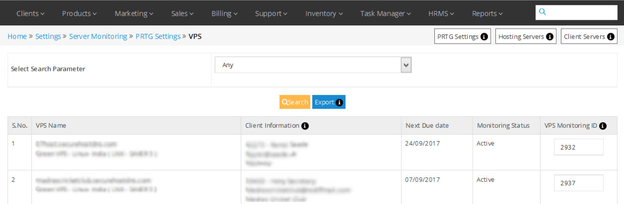
Search VPS Server
To search a VPS server from the complete list, use the Search box provided in the VPS section.
- Select Search Parameter (Hostname/Client ID/Client Email) from the search dropdown list.
- Enter the appropriate information.
- Click on the Search button.
Export VPS Details
To export the complete details of the VPS with PRTG server monitoring ID in a CSV (excel) file.
- Click on the Export button in the VPS section.
CACTI Settings
Home >> Settings >> Server Monitoring >> CACTI Settings
In the CACTI Settings section, you can configure and integrate CACTI with the automation platform for monitoring the server networks. These settings can be done for available hosting servers, client servers and VPS.
To access the CACTI Settings section:
- Go to Settings.
- Click on CACTI Settings in the Server Monitoring section.
In the main CACTI Settings section, you can view and edit the configuration for integration of CACTI with the Automation Platform.
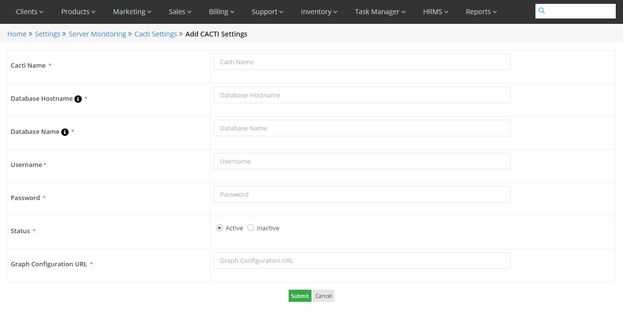
Add New CACTI Server
You can also add new CACTI server by clicking on the Add Button, where you have to enter the following details.
You can enter/edit the following entities.
- Enter CACTI name.
- Enter Database Hostname (Server where CACTI database is located).
- Enter Database Name (Name of CACTI database).
- Set Username & Password of the server.
- Set Status of the server- Active/Inactive.
- Add Graph Configuration URL. .
- Click on the SUBMIT button to save the settings.
See sample screenshot of the CACTI settings section:
View/Edit CACTI Settings for Hosting Servers
Home >> Settings >> Server Monitoring >> CACTI Settings >> Hosting Servers
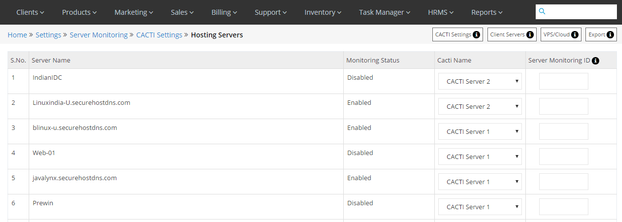
In the Hosting Servers section, you can view and edit the CACTI Server Monitoring ID for the available hosting servers.
To access the Hosting Servers section:
- Click on the Hosting Servers button.
In the Hosting Servers section, the information about the Hosting Servers is listed in the below given sequence.
- Server Name – Monitoring Status (Enabled/Disabled) – CACTI Name – Server Monitoring ID
Here, you can enter/edit the CACTI server monitoring ID for each server to enable monitoring of the server network with CACTI.
See sample screenshot of the Hosting Servers section:
Export Hosting Server Details
To export the complete details of the hosting servers with CACTI server monitoring ID in a CSV (excel) file.
- Click on the Export button in the Hosting Servers section.
View/Edit CACTI Settings for Client Servers
Home >> Settings >> Server Monitoring >> CACTI Settings >> Client Servers
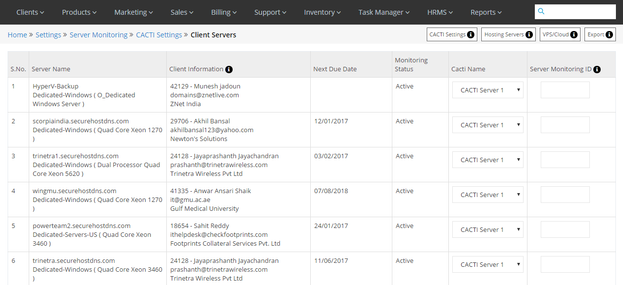
In the Client Servers section, you can view and edit the CACTI Server Monitoring ID for the allotted client servers.
To access the Client Servers section:
- Click on the Client Servers button.
In the Clients Servers section, the information about the Client Servers is listed in the below given sequence.
- Server Name – Client Information – Next Due Date – Monitoring Status – CACTI name – Server Monitoring ID
Here, you can enter/edit the CACTI server monitoring ID for each client server to enable monitoring of the server network with CACTI.
See sample screenshot of the Client Servers section:
Export Client Server Details
To export the complete details of the client servers with CACTI server monitoring ID in a CSV (excel) file.
- Click on the Export button in the Client Servers section.
View/Edit CACTI Settings for VPS/Cloud
Home >> Settings >> Server Monitoring >> CACTI Settings >> VPS/Cloud
In the VPS/Cloud section, you can view and edit the CACTI Server Monitoring ID for the allotted VPS/Cloud.
To access the VPS/Cloud section:
- Click on the VPS/Cloud button.
In the VPS/Cloud section, the information about the each VPS/Cloud is listed in the below given sequence.
- VPS/Cloud Name – Client Information – Next Due Date – Monitoring Status – CACTI Name – VPS/Cloud Monitoring ID
Here, you can enter/edit the CACTI server monitoring ID for each VPS/Cloud to enable monitoring of the VPS/Cloud network with CACTI.
See sample screenshot of the VPS/Cloud section:
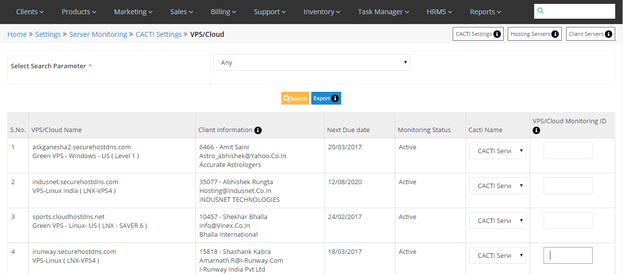
Search VPS/Cloud Server
To search a VPS/Cloud server from the complete list, use the Search box provided in the VPS/Cloud section.
- Select Search Parameter (Hostname/Client ID/Client Email) from the Search dropdown list.
- Enter the appropriate information.
- Click on the Search button.
Export VPS/Cloud Details
To export the complete details of the VPS/Cloud with CACTI server monitoring ID in a CSV (excel) file.
- Click on the Export button in the VPS/Cloud section.